Saudi Arabia Data Set

2,500
companies
450,000
data points
500
investors
150 parameters
Gulf Region Tech Industry Dashboard
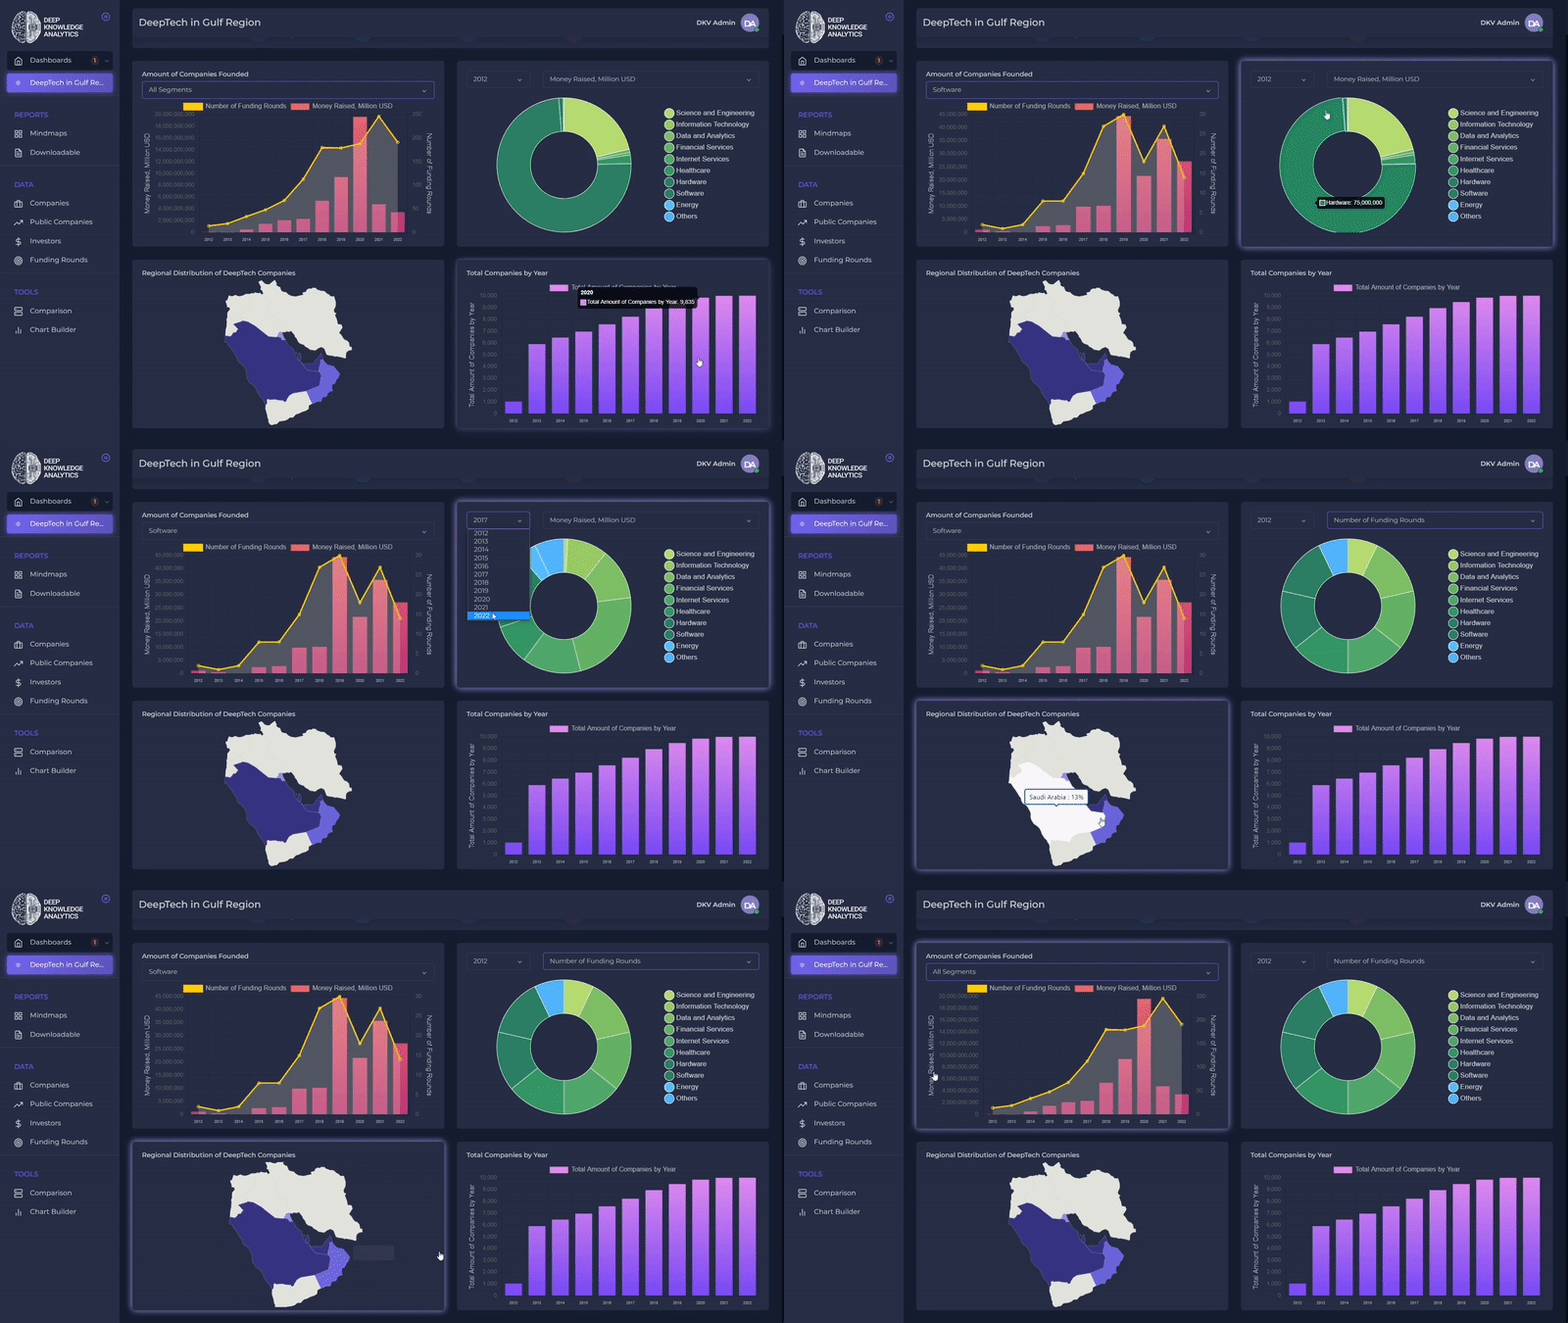
The video demonstration of Deep Knowledge Group's Gulf Region Tech Industry Dashboard highlights its cutting-edge features in AI-driven Big Data analytics. Tailored for regional decision-making, the dashboard provides real-time insights into market trends, industry benchmarking, and operational ecosystem mapping. It integrates dynamic visualizations, interactive modules, and predictive analytics to enhance strategic planning.
Dashboard Features Overview

FOR INVESTORS
Locate Companies and Take a Closer Look at Them
Browse DeepTech companies, scale-ups and public companies to invest in or work with:
-
Analyse industries and companies of interest
-
Monitor updates in real time
FOR COMPANIES
Funding Rounds
See all the funding rounds from the GovTech companies in one place. Search the information by the organization name or explore the catalog of the founding rounds for all the companies in the DeepTech sector. You can click on the investors name for the investor profile details and pin the investor to your watchlist.


FOR INVESTORS
Companies Comparison
Explore companies with unseen precision. Many investors can confirm that looking for a suitable investment target starts with the creation of the database. The one that suits his/her needs and allows him/her to ask the right questions. Research public and private companies, compare them with ease and make impact decisions.
FOR COMPANIES
Investors Database
Get a comprehensive set of data about investors aggregated from numerous data sources.
-
View the portfolio structure of every investor in the database
-
Map the network of investors operating in the Gulf Region
-
Conduct effective market intelligence on investor’s activities to make vetted decisions


FOR INVESTORS
Interactive Chart Builder
Interactive Chart Builder allows creating the charts based on the user’s desired parameters. Relying on the extensive database, this tool can visualize the data about organizations operating in the Gulf Region.
-
Easy-to-use tool for data visualization
-
Data for charts is aggregated from a large number of external sources
-
Clearly represented comparisons of parameters on the charts
FOR COMPANIES
Portfolio Construction Tool
The built-in tool lets dashboard users check out how selected public companies would perform under various investment strategies if a person had invested in them before.
-
Users may choose among different strategies or adjust weights to find the best outcomes
-
Backtesting of the portfolio might shed light on how the equity basket would behave in the future


FOR INVESTORS
Stock Prices Prediction Tool
Predictions tool allows to build forecasts on equities prices based on different approaches and compare them in real-time.
-
Advanced AI algorithms allow to achieve the additional precision of prediction results
-
Users can define the prediction time horizons
-
Get the visualization of forecasting
FOR COMPANIES
Heatmap Analysis
Heatmap Analysis is a tool aimed at delivering the visual representation of public companies analysis.
-
Users can select the companies they are interested in, set up the specific time range for which analysis will be done
-
Heatmap will outline the extreme data points which can be crucial for decision-making


FOR INVESTORS
Automated SWOT Analysis
Automated SWOT Analysis is an analytical tool available for each company in the database of the Dashboard.
-
The tool provides the aggregated scoring of companies based on the primary and alternative data
-
Assessment results are validated through Artificial Intelligence engine
-
Handful tool for making the aggregated conclusion on the overall performance of the given company
.png)


